Platform
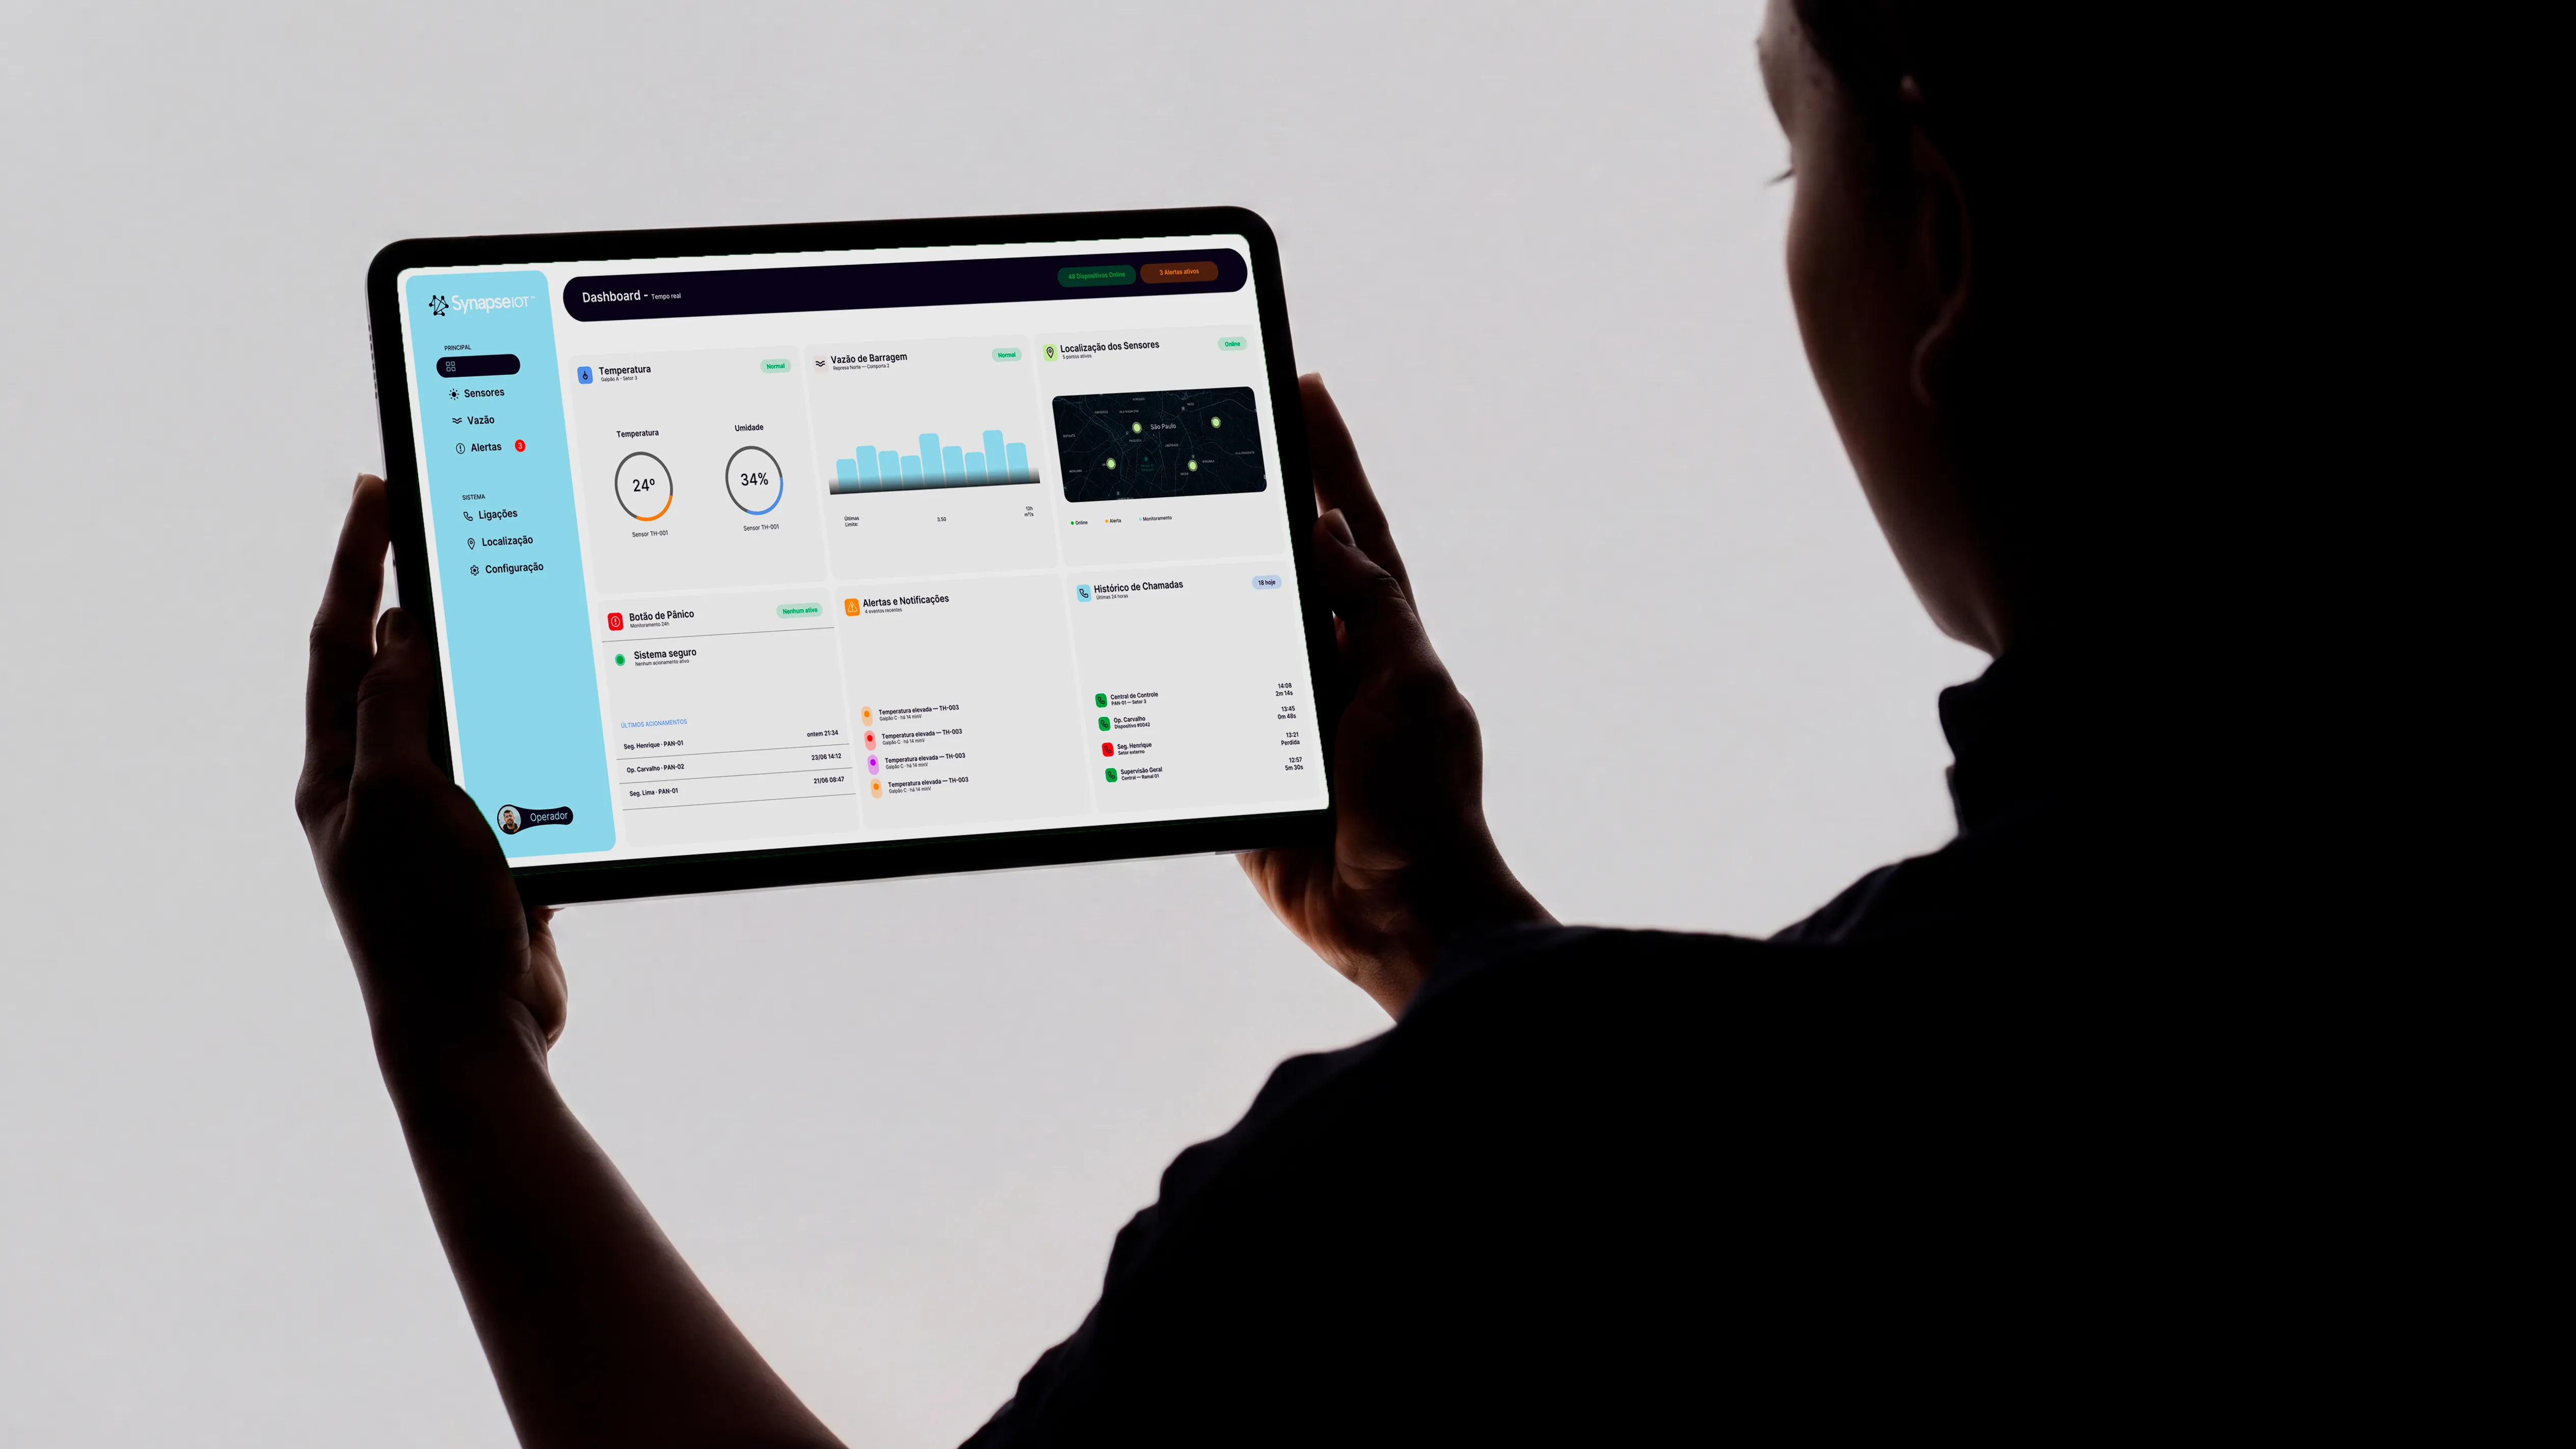
Dashboards, maps and alarms on one screen
Indicators, history, maps and alarm rules gathered in a web dashboard, with a consolidated view of assets, variables and operational units.
- Dashboards
- Maps
- Alarms
Connect distributed assets, centralize field information and turn data into dashboards, alarms, history and operational decisions. From the device to the decision, without losing context.
Contact us


























Sensors, machines and equipment from different manufacturers usually operate in silos, using distinct protocols and disconnected interfaces. Without a common integration layer, the data exists but never turns into visibility or action. SynapseIOT connects the field to the operation and organizes the data in a single view.
Indicators, history, maps and alarm rules gathered in a web dashboard, with a consolidated view of assets, variables and operational units.

Urban, industrial, rural and remote environments monitored by the same platform.
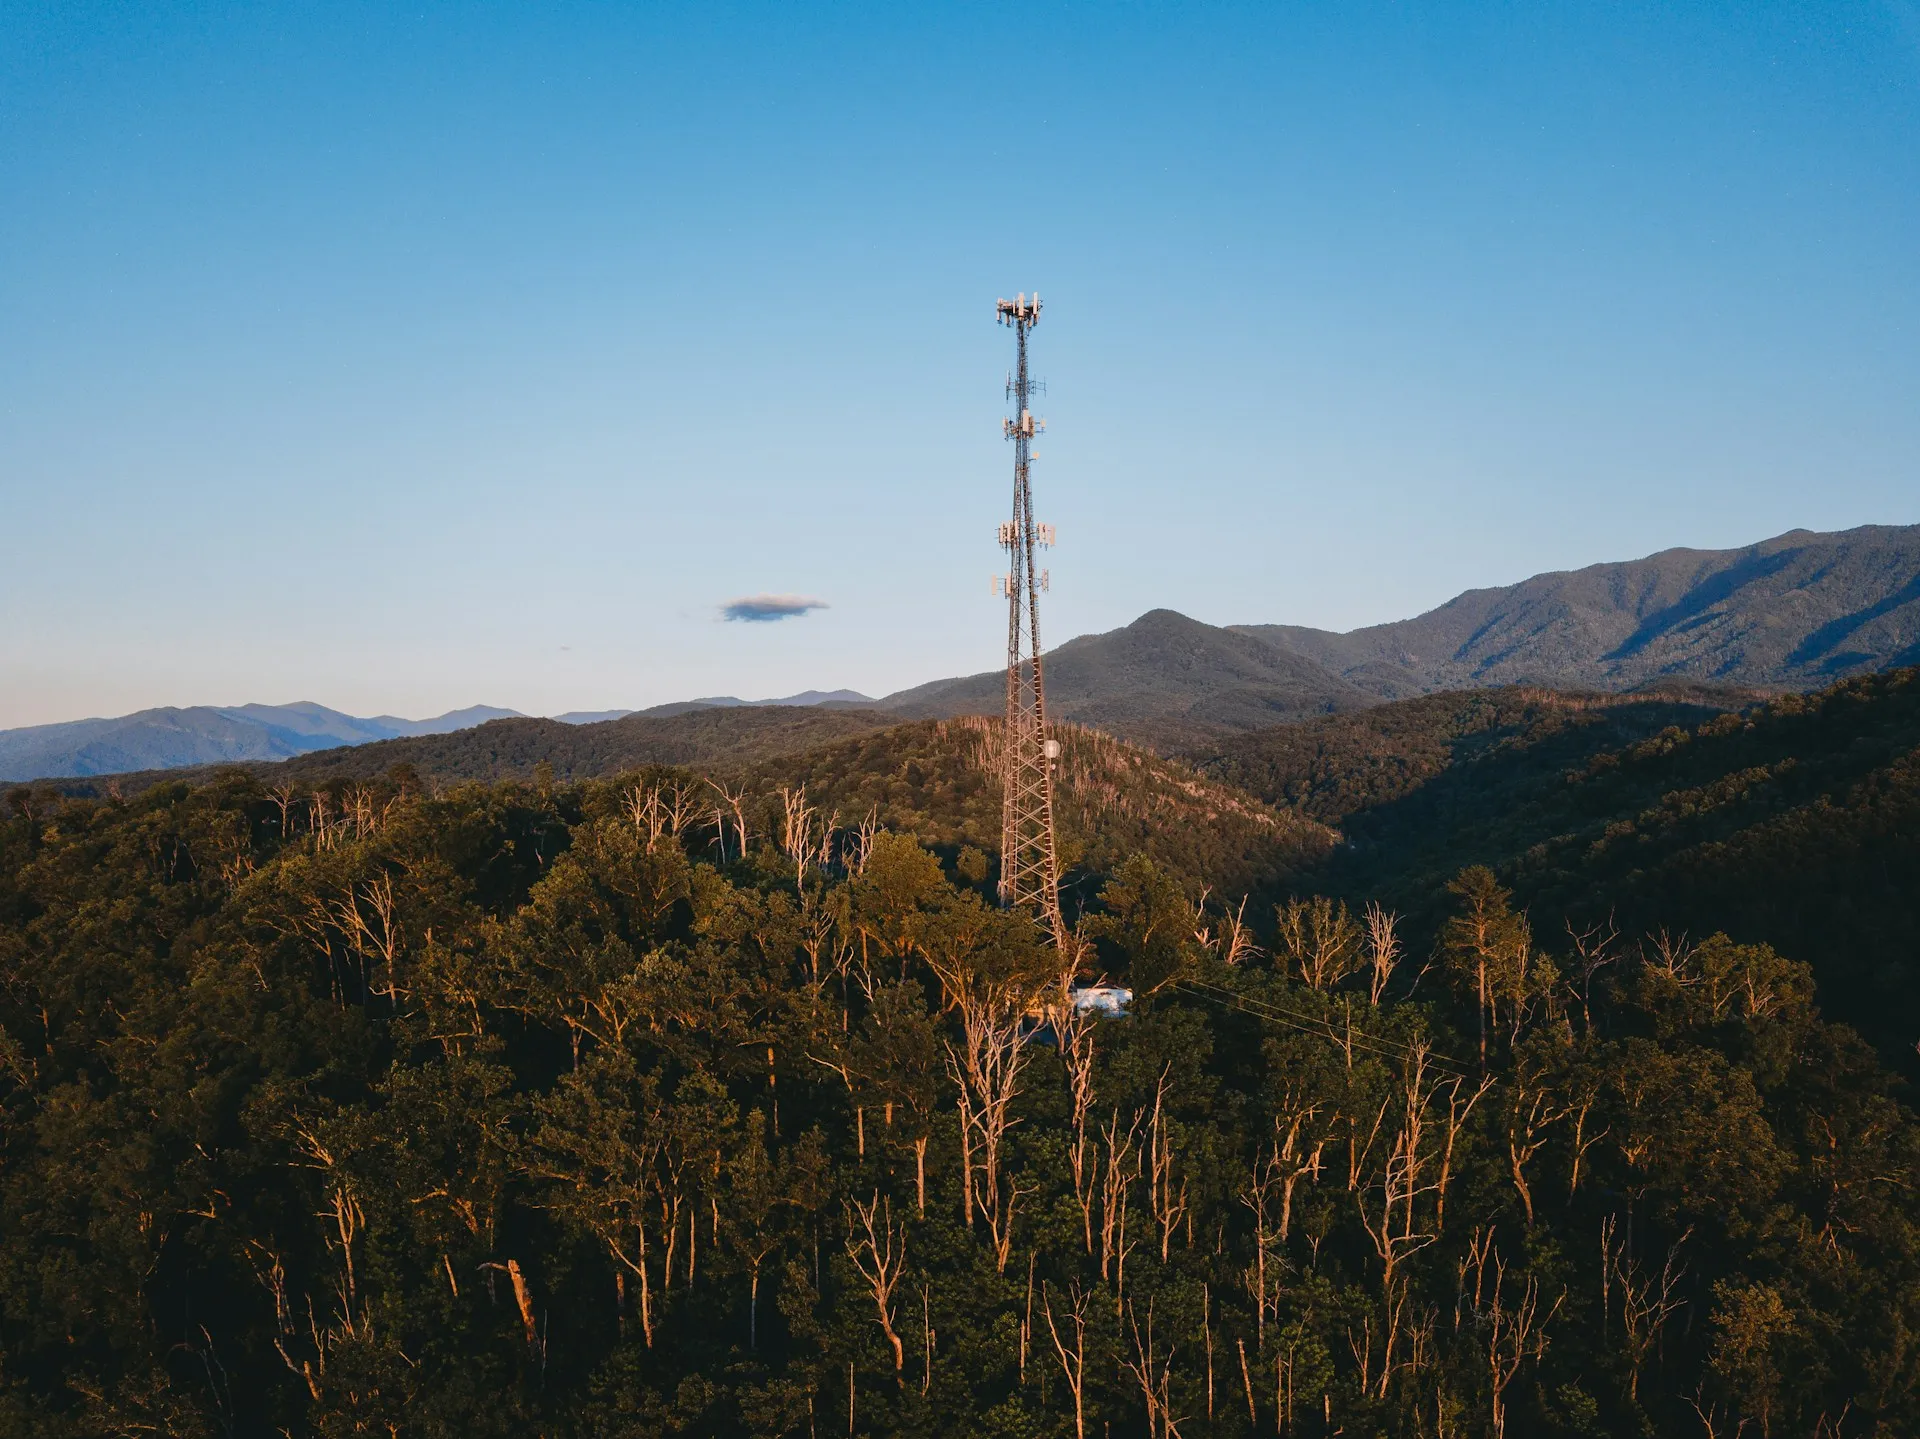
LoRaWAN, MQTT, Modbus, OPC UA and APIs connecting sensors, gateways and machines from different manufacturers in one common layer.

Collection in local, remote or distributed environments, with connectivity over Bluetooth, Wi-Fi, Ethernet, NB-IoT, LTE and 5G.
SynapseIOT connects devices across different technologies, organizes the collected variables, and delivers dashboards, alarms and history ready for the operation — in cloud, on-premise or hybrid deployments.
Integration with LoRaWAN, MQTT, Modbus, OPC UA and APIs, plus connectivity over Bluetooth, Wi-Fi, Ethernet, NB-IoT, LTE and 5G. Sensors, gateways, machines and devices from different manufacturers start speaking the same language.
Data is collected in local, remote or distributed environments, with an architecture built for cloud, on-premise or hybrid operation. The platform adapts to your operation's topology, not the other way around.
Web dashboards, maps, indicators, history and alarms with the status and connectivity of each device. Configurable rules identify deviations and operational events as soon as they happen.
Connection to SCADA, databases, ERP and corporate systems through open APIs, carrying field data all the way to industrial and management processes with no rework or re-typing.
Everything you need to know before bringing the SynapseIOT platform to your operation.
It's an IoT platform that connects sensors, machines and equipment from different manufacturers and organizes field data in a single view. Dashboards, maps, indicators, history and alarms live in the same environment, from the device to the decision, without losing context.
Sensors, machines and equipment usually operate in silos, with distinct protocols and disconnected interfaces. Without a common integration layer, the data exists but never turns into visibility or action. SynapseIOT is that layer: it centralizes heterogeneous equipment, reduces the complexity of querying multiple systems, and keeps a history of variables and events for operational analysis.
The integration is multitechnology, covering both application protocols and transport media:
No. The platform connects sensors, gateways, machines and devices from different manufacturers, making use of the infrastructure already installed. The idea is to add a common layer over what exists, not to rebuild your equipment fleet.
The data arrives ready to track the behavior of each asset and the network that supports it:
You configure the rules for each variable, and the platform flags it as soon as behavior strays from the expected pattern. The same rules identify operational events and connectivity failures, letting you act on a deviation before it becomes an outage.
Both ways. The architecture is built for cloud, on-premise or hybrid operation, and collection happens in local, remote or distributed environments. The topology follows the reality of your operation, including edge processing when the scenario calls for it.
Yes. The integration is open, connecting to SCADA, databases, ERP and corporate systems. Data collected in the field reaches operations, maintenance and management areas with no rework or intermediate re-typing.
In any operation with distributed assets and variables that need close tracking:
The platform is built for dispersed infrastructure. Collection happens in remote and distributed environments, and tracking by map and by operational unit keeps every point visible, even when it's far from the operation's center.
Yes. Variables and events are stored and available for operational analysis, letting you compare periods, investigate incidents, and use the historical base as a starting point for automation, traceability and analytics.
Yes. Sensors, gateways and applications are added progressively, without rebuilding what's already in production. The same environment covers everything from a pilot with a handful of devices to infrastructure spread across several operational units.
No. The dashboard is built for direct operational use: map, indicators, history and alarms on a single screen, with a quick view of the information that matters to whoever tracks the operation day to day.
Access is controlled end to end and every event is logged:
An IoT platform that connects sensors, machines and equipment from different manufacturers and turns field data into dashboards, alarms, history and operational decisions.
Request a demoGovernance and documents
COM3 OUTSOURCING & PROJECTS LTDA · CNPJ: 41.713.237/0001-05
© 2026 SynapseIoT™ ·All rights reserved. ·